Demand Planning

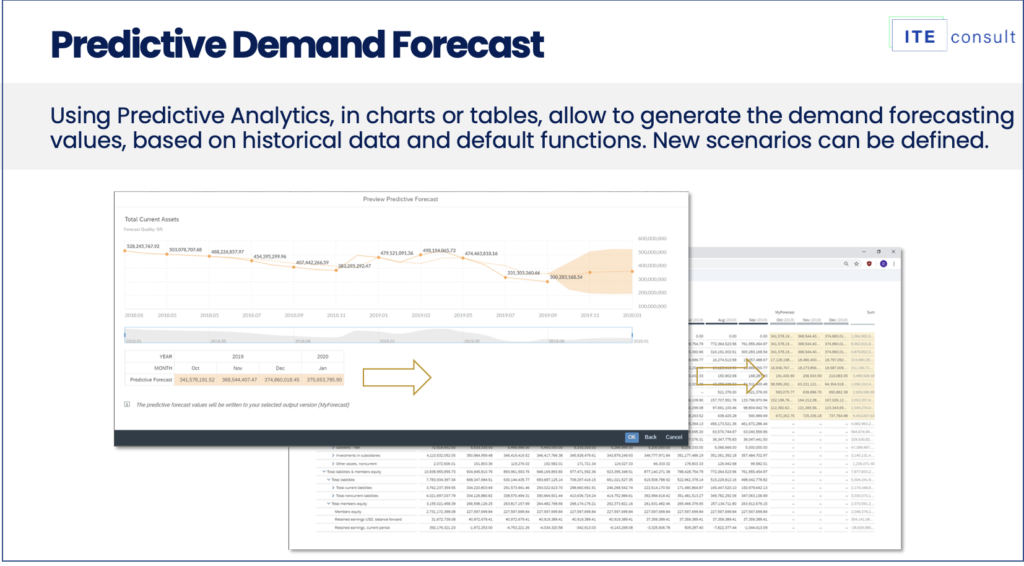
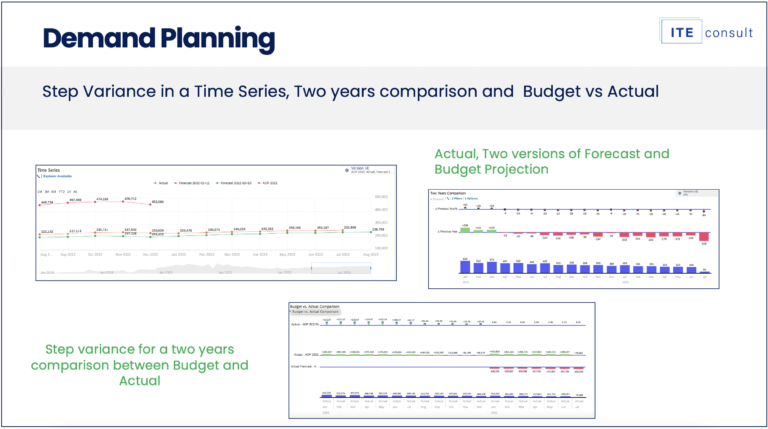
The Demand Planning solution is part of our cloud platform, where you can  forecast your demand using predictive scenarios, and manually adjust your demand plan with “lifts” defined by Sales & Marketing teams. You can also compare different forecast versions with your actuals and budget, visualize the trend, the projection, the MAPE & BIAS, and other metrics & KPI´s.

The process flow and planning calendar will help the user follow the process, as it provides a user friendly interface that drives the user through the different planning steps. The planner admin is able to schedule the monthly activities in the calendar built-in the planning platform.

Together with the Supply Planning solution, it integrates the Supply Chain Management platform, and the Sales & Operations planning solution, providing a friendly and easy user experience for demand and supply planners.

Demand Planning

SPOT Data Structure

The Demand Planning solution, incorporates a “Single Point of Truth” data structure, to handle the Actual data and the Master Data governance.

The Actual data can be loaded from multiple data sources, creating a master data structure, that will give the planners the data governance, to create new members and grouping hierarchies for planning and analytic purposes, all managed with daily, weekly or monthly scheduled updates. This model secures your data in a single point of truth, avoiding all housekeeping work, and making your data ready to run predictions. Powered by SAP Analytics Cloud.

Predictive Analytics

The predictive analytics component, allow planners to define which type of predictions to run, selecting the measures to be forecasted and defining the historic data to be analyzed, while using influencers, with different statistical models, using previously created planning hierarchies, to define data grouping, and exclude outliers. All can be executed from a planning button, so there is no need to deeply understand statistics, the solution will do it for you!


Predictive analysis will show the impact of trends, cycles, seasonality and outliers in your predictions. With machine learning it will show you the estimated MAPE of your forecast.

Manual Forecasting Building Blocks

Use Top-Down planning functionalities to input uplifts, distributions, adding new products, once the statistical baseline has been created. Based on Building blocks concept, to keep track of the forecast changes.

Demand Forecast Analytics.

Use Stories and dashboards to analyze MAPE and BIAS. keep track of your planning versions. visualize your demand plan KPI´s compared with actuals and budget. Use selected forecast version to build your operational plan. using the Supply Network Optimizer all integrated on the same platform!

Why choose Us

Cloud management platforms for performance and sustainability

Why choose Us

 Network supply systems to increase profit and opportunities

Why choose Us

Use of digital twins and optimization algorithms to build plans and drive actionable decisions

Why choose Us

Cost-effective Labor Empowerment | Continuous User training and on-going support with Process improvement

WE CAN HELP YOU !

To improve the profitability of your processes

💬 Hi, How can we help you?